Kenny Dunn

Data Driven Leader
Skilled in SQL, Tableau and Excel
Love Finding Business Insights Through Data Analysis
Husband, Girl Dad, Poodle Dad, Foodie, Baseball Fanatic and Sports Enthusiast
View My LinkedIn Profile
Welcome to My Portfolio
Learn About My Projects
2023-24 NBA Data Analysis

In this project I explored NBA Player data from the 2023-24 regular season. The data includes 572 rows and 30 columns, offering detailed statistics for 523 players. I utilized Tableau to create dashboards and a Tableau Story.
I created Bubble Plots, Stacked Bar Charts, Heatmaps, and Tree Maps to display the data.
🏀 Luka Dončić and Nikola Jokić clearly dominate the offensive side of the game.
🏀 Luka Dončić may be underrated as a defensive player but that side of the game is clearly dominated by centers with Victor Wembanyama being the clear top flight player here.
🏀 PG’s and SG’s are the clear favorites in 3 PT% but a few teams have Centers that shoot the 3 well.
🏀 Most teams have at least two players that dominate the scoring on the team.
🏀 PG’s dominate assists per team and position but there are outliers such as Nikola Jokić for Centers and Pascal Siakam for PF’s.
Healthcare SQL Analysis

This project allowed me to explore healthcare data from 130 hospitals across the U.S. The data spans from 1999-2008 and included multiple tables within the dataset. I utilized MySQL to run SQL queries
and utilize the following functions to do that:
GROUP BY Function • HAVING/DISTINCT Function • ORDER BY Function • COUNT Function • AVG Function • CASE WHEN Functions • JOIN Function
⚕️Explored the Average length of stay in the hospital.
⚕️Identifyed the medical specialties with the highest average procedure orders
⚕️Investigated the correlation between the quantity of procedures administered to a patient and the duration of their hospital stay.
⚕️Investigated whether race influences the level of care received.
World Bank SQL Analysis
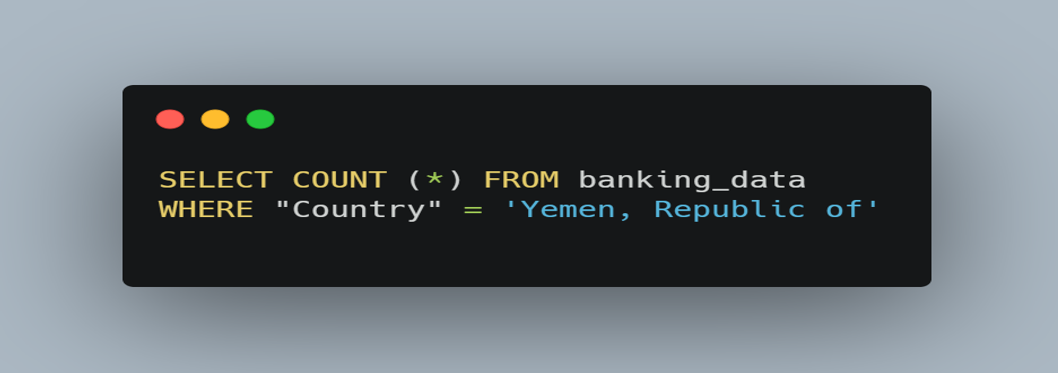
This project allowed me to explore IDA data from the World Bank. I chose to focus my analysis on the Republic of Yemen. I utilized CSVFiddle to run SQL queries
and utilize the following functions to do that:
AS Function • GROUP BY Function • MAX Function • ORDER BY Function • COUNT Function • AVG Function • AND/OR Functions • WHERE Function
💲What types of Programs are funded?
💲What State Department borrowed the money?
💲What the Credit Status of the Loan is.
iFood Data Excel Project
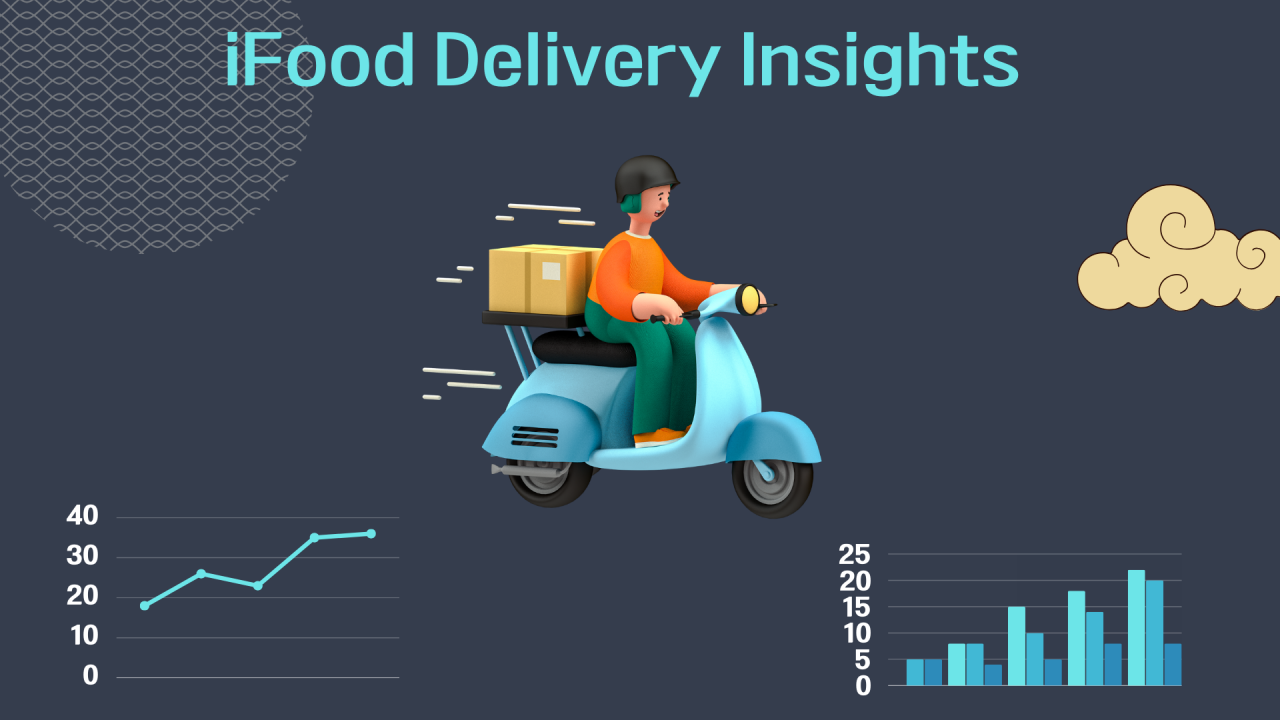
iFood is the Brazilian equivilant to Door Dash and I analyzed the data to gain insights into the customers that they serve. I created bar charts, scatter plots and pivot tables. The data revealed:
🥩The causal relationships between income and order amounts.
🍕How marital status and having kids at home affected spending.
🍔The months that had the highest number of new member acquisitions.
Massachusetts Dept. of Education Tableau Project
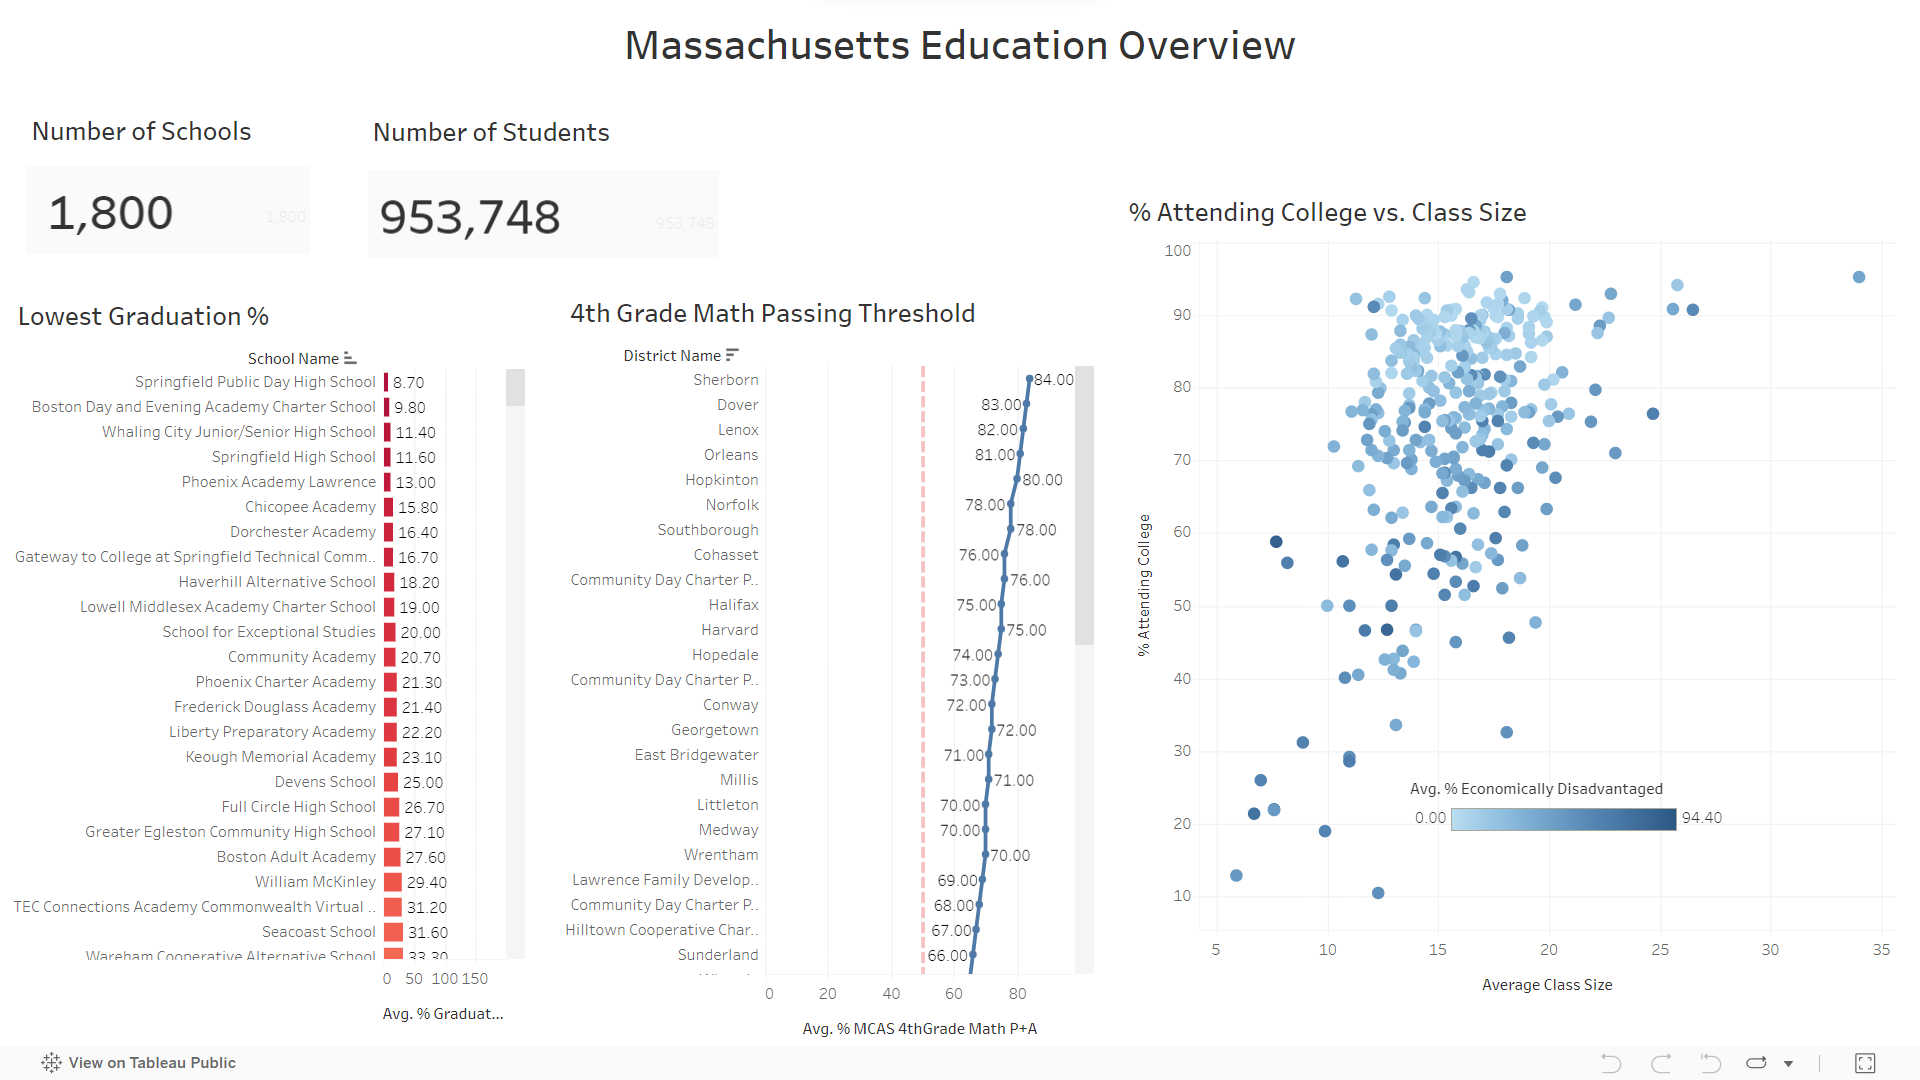
In this case study from Data Analytics Accelerator, I was prompted to analyze the State of Massachusetts education data. The main focuses were:
👨🎓What High Schools had the lowest graduation percentages?
👩🎓How does class size affect college admission?
✒️What are the top 4th grade math schools in the state?
AirBnB Seattle Tableau Project
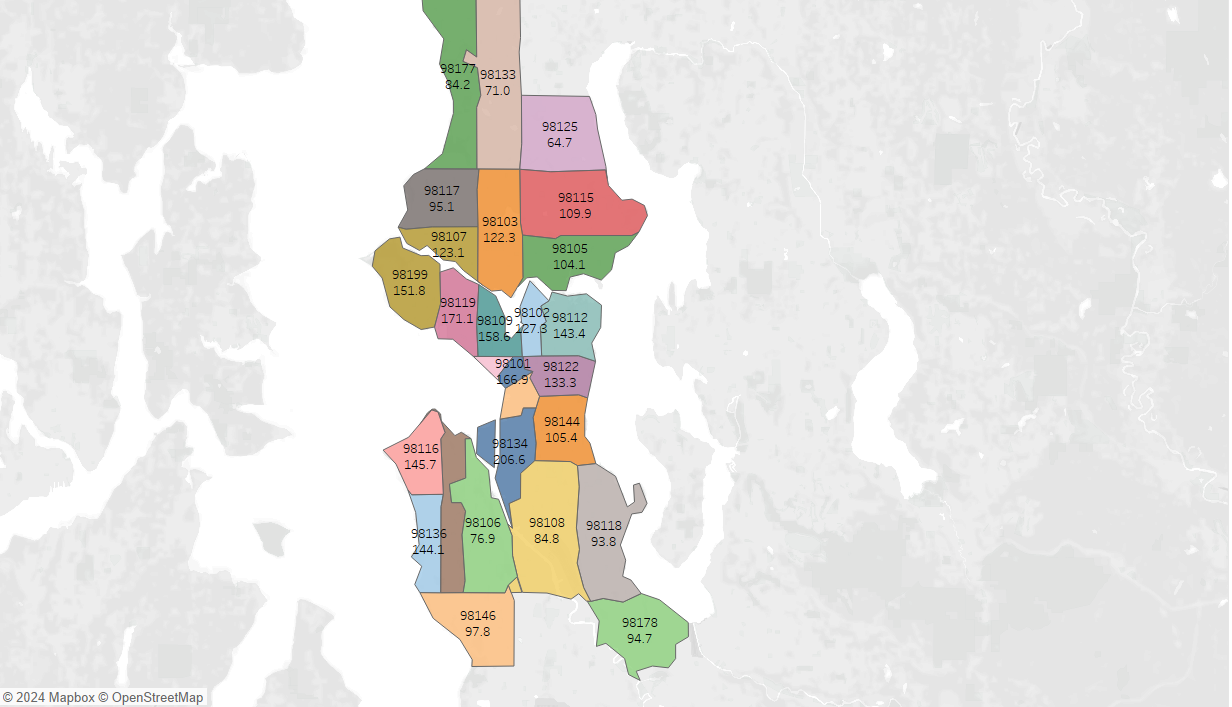
In this case study I analyzed AirBnB data for the city of Seattle. There were three things that I was really focused on in analyzing this data and they were:
🛌Which Zipcodes have the highest prices for a rental?
🛌What months had the most revenue?
🛌Did the number of bedrooms in a rental affect rantability?